
Beach Cities Market Update May 2019
It’s game time for Buyers and Sellers right now and I don’t mean the NBA playoffs or Game of Thrones. I’m referring to the next few months being the traditional selling season even if we don’t particularly have seasons here in LA.
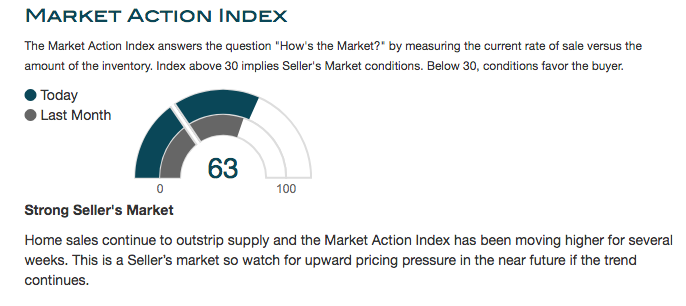
As I’ve written elsewhere, a funny thing happened on the way to the “market shift”. While there are certain differences in today’s buyer-seller dynamic, it is not the “Buyer’s Market” that many were predicting. What we are seeing is very strong demand fueled by what are still historically low rates.
So let’s take a look at Jan-April sales in the Beach Cities and where we are in May.
Oh, if you are not familiar with the “Beach Cities” but are here anyway, I’m referring to Manhattan Beach, Hermosa Beach, and Redondo Beach which are also part of the Greater South Bay region of Los Angeles.
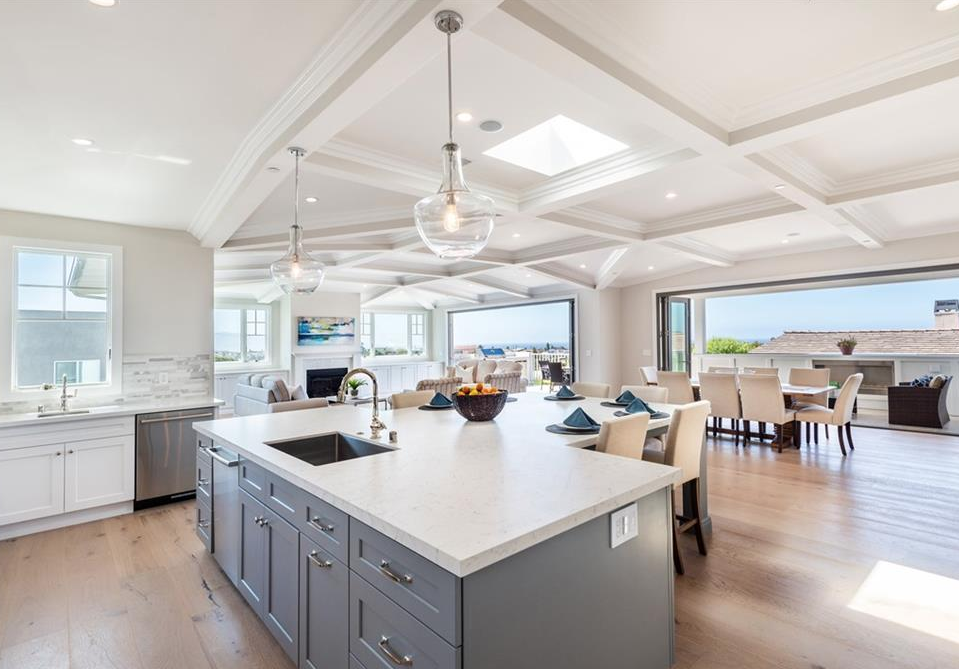
MANHATTAN BEACH
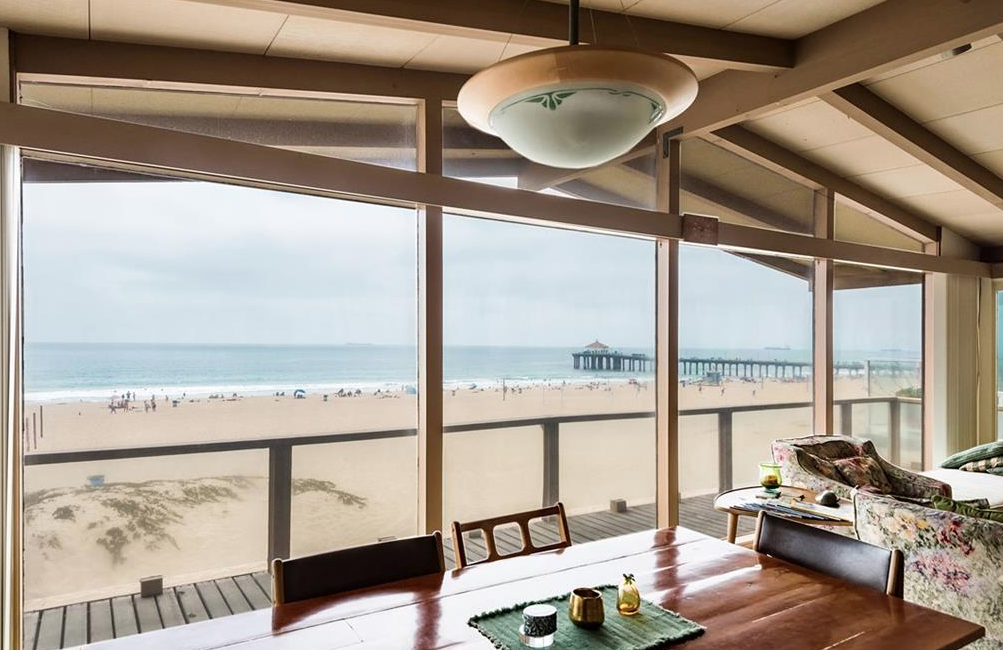
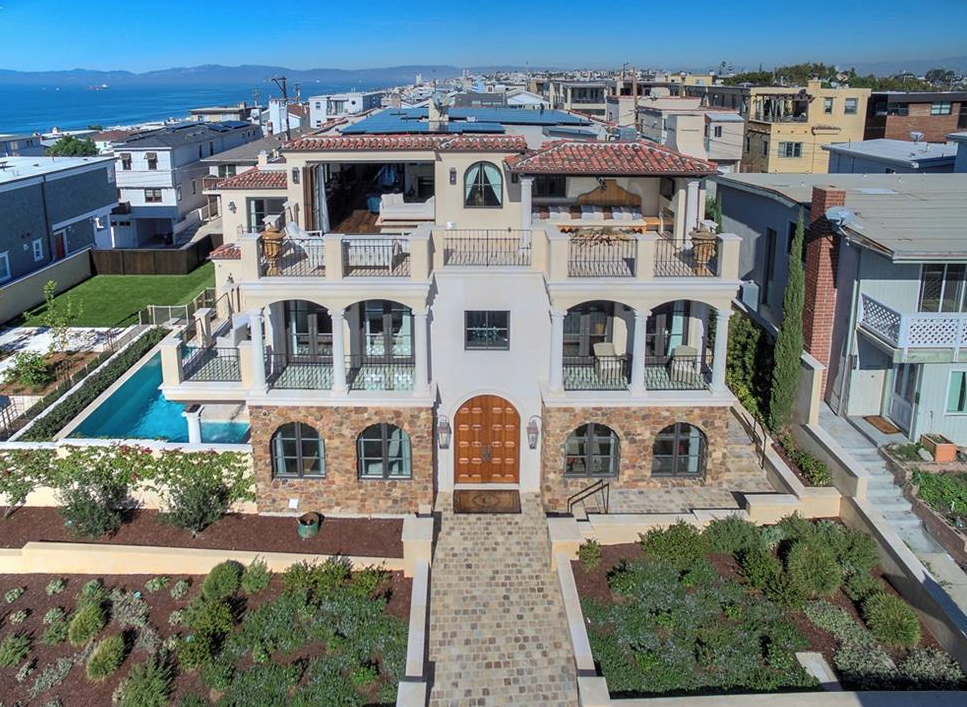
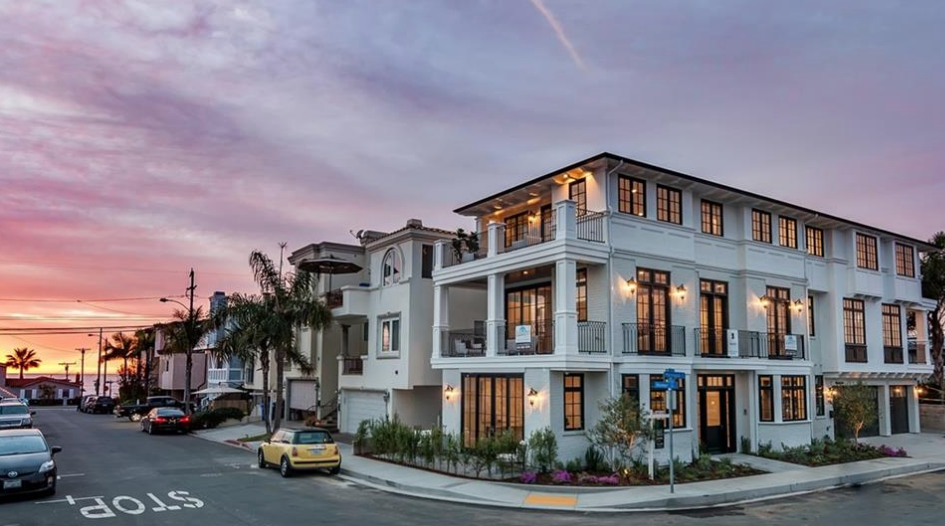


Through the first 4 months of 2019, there have been 121 closed escrows in 90266. This is actually up from 105 sales during the same period in 2018 by about 16%. The median price during this time frame for 2019 was $2,197,500 compared to $2,257,500 in 2018. So median down but sales up. This year we did see a sale close for $16,000,000 whereas for the same time frame last year the top sale was $8,050,218.
For the first four months months of 2018 there were 7 sales over $5M and this year 9.
Here’s the sales by month:
January 20
February 18
March 39
April 44
Let’s take a deeper dive into the price brackets, what’s selling and where.
Sales Price Brackets
There have been 8 sales under $1M in Manhattan Beach through the first 4 months of 2019. Not surprisingly, they were mostly 2 bedroom condos and townhouses located on or near the busier streets of Atresia Blvd and Manhattan Beach Blvd.
In fact, there weren’t any SFR sales until we get to $1,155,000 and that really was for land value although yes, there was a house on it. It took a little over $1.2M to get a 2 bedroom SFR that is livable.
In all, 42 homes sold between $1-$2M. That’s about 35% of the total. Adding the 8 sales under $1M, that 41% of the overall sales.
Over $2M and under $3M there were another 40 sales. Between $3M-$4M 16 sales and over $4M 15 sales.
Single Family Residence vs Townhouse / Condominium
In Manhattan Beach SFRs dominate the market with 93 out of 121 sales (77%) being houses. The balance, 38, were Townhouses and Condos.
Manhattan Beach Sales by Micro Market
Sand Section 31
Tree Section 40
Hill Section 6
Village 4
Heights / Liberty 19
Mira Costa 21
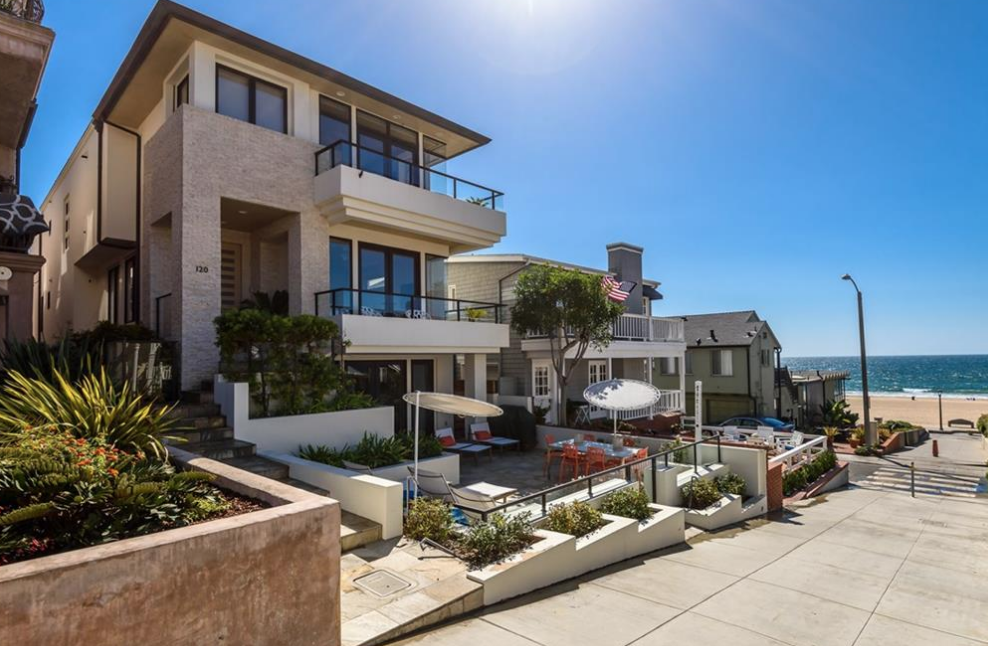
HERMOSA BEACH

January through the end of April 2019 there were 54 closed escrows in Hermosa Beach compared to 59 for the same period in 2018.
2019 sales ranged in price from $499,000 up to $7,325,000 with a median price of $1,625,000. For 2018 the price range was $495,000 on the low end up to $8,175,000 on the high end with a median of $1,700,000.
So in the case of Hermosa Beach, 2018 started off stronger for sure.
Here’s the sales breakdown by month:
January 6
February 16
March 19
April 18
Sales Price Brackets
Of the 54 closed sales so far in 2019 in Hermosa Beach, 6 were under $1M, 29 between $1M-$2M, 11 between $2M-$3M and 8 over $3M.
Single Family Residence vs Townhouse / Condominium
In Hermosa Beach SFRs were 25 out of 54 sales (46%). The balance, 29, were Townhouses and Condominiums with 4 being flat apartment like condos.
Hermosa Beach Sales by Micro Market
Sand Section 25
Valley 12
East / Hills 17
REDONDO BEACH

As always, I will look at North and Redondo Beach separately because for all intents and purposes they are separate and different markets.
North Redondo
Through the first 4 months of 2019, there have been 138 closed escrows in 90278. This is actually slightly less than the 142 sales during the same period in 2018. The median price during this time frame for 2019 was $960,000 compared to $1,010,000 in 2018. So both median and sales down. This year we did see 3 sales close for over $2M and one for $1,999,000 whereas for the same time frame last year the top sale was $1,950,000.
Here’s the sales by month:
January 16
February 28
March 44
April 50
Sales Price Brackets
75 sales were under $1M (54%). The “sweet spot” is between $1M and $1.4M which contributed another 42 sales and the balance were over $1.4M.
Single Family Residence vs Townhouse / Condominium
In North Redondo Beach SFRs were 45 out of 138 sales (33%). Condominiums (flat apartment style) and Townhouses were the balance of the properties sold. N Redondo has a much higher condo - townhouse contribution factor than Manhattan or S Redondo.
North Redondo Beach Sales by Micro Market
Golden Hills 19
El Nido 18
N Artesia Blvd 53
S Artesia Blvd 46
South Redondo
Through the first 4 months of 2019, there have been 135 closed escrows in 90277. So just slightly lower than 90278 and much higher than the 108 sales during the same period in 2018. Actually quite a healthy YOY increase of about 29%. Nice!
The median price during this time frame for 2019 was $1,140,000 compared to $1,245,000 in 2018. So median down and sales up.
Here’s the sales by month:
January 28
February 29
March 36
April 42