
Beach Cities Real Estate Market Update July 2020
We now have 3 full months of post “Safer at Home” data and the Real Estate market is surprisingly healthy although different and changed in many ways.
The big picture is that there are a lot of buyers out shopping (with masks on), not enough inventory in many price and property categories, and yes, there are multiple offers and prices still going up in many instances.
But overall unit sales are down.
Here’s a quick snapshot of Q2 sales in the Beach Cities 2020 compared to 2019.
Q2 Beach Cities Sales 2017-2020
Sales are down as stated above. Let’s take a look at how this has affected median prices.
(Click on the graphs for the full report. The following data is for SFRs.)
NORTH REDONDO BEACH

SOUTH REDONDO BEACH

HERMOSA BEACH

MANHATTAN BEACH

So a lot to unpack from all this data. Let’s get started.
NORTH REDONDO BEACH
Sales are down, prices are up. In my opinion, there’s 2 drivers for this. First, new construction in 90278 has become really expensive with 3 on a lots selling for what detached 2 on a lots were selling for just a few years ago. Expect to pay $1.2+ for a nice new 3 on a lot or around $1.5-$1.6M for a detached two on a lot or Golden Hills Tall & Skinny.
On the other end of the spectrum, the sub $1M price point in North Redondo is extremely competitive.
What’s not selling as well are dated properties around $1.1M to $1.2M that don’t have desirable floor plans. And there’s a lot of those for sure.
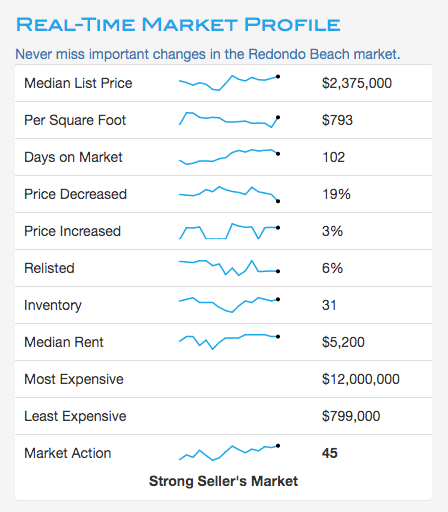
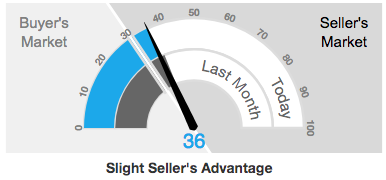
North Redondo is still considered a strong Seller’s Market. Here’s a link to the market report.


Visit 90278MarketReport.com for all the data
This data is for Single Family Residences but the data for Condos and Townhomes is not much different.
With the high demand for North Redondo Beach, I don’t see this situation changing anytime soon.
For the past dozen years or so, 90278 has been one of the hottest zip codes in coastal LA County.
SOUTH REDONDO BEACH
Sales are down, prices are up. Is that starting to sound familiar? During the early days of the pandemic right after the Safer at Home, South Redondo was performing a little differently than the rest of the Beach Cities but things have balanced out now. Still a Seller’s market though. Check out the full Market Report.

Compared to North Redondo Beach, South Redondo has a much higher median price but the price per Sq Ft overall is not that much different.
The days on market is much higher but that may be a function of the higher price point. The inventory is higher than in 90278.
HERMOSA BEACH
This data really surprises me, 18 sales during June compared to 15 the same month the year before and 10 in May 2020. So what’s selling? Everything from entry level condos under $1M up to the Strand for $12M.
Of the 18 sales, 14 were below the MLS list price and 4 were at the list price. Nothing sold over.
New construction comprised a lot of the sales with 5 of the homes being 2019 - 2020 builds. Then curiously the next sold property was built in 1998 so there’s a 20 year gap. Interesting.
Eleven of the 18 sales were in the Sand Section and of course lower priced than they would have been further north in the Manhattan Beach Sand Section. Having lived in both over the years I can tell you there isn’t just that much of a difference. The big change is going east of PCH.


The strength of the Hermosa market is always a function of Manhattan Beach Prices and as long as Buyers perceive there is value, meaning similar properties at a somewhat lower price point, Hermosa should continue to perform well.
MANHATTAN BEACH
Saving the best, or at least most surprising, for last, 90266 really has me thinking a lot these days. There were more properties sold in MB in June than the other Beach Cities (unless I were to combine North and South Redondo which I don’t for these updates.)
So more properties and at a higher price point. Go figure.
And what’s selling? Everything.
Out of 30 sales, 9 sold above the asking price and 19 below. Ten of the sales were in the Manhattan Beach Sand Section, 7 in the Trees, 2 in the Hill Section and everything else was East Manhattan including Manhattan Village.
